zrender实现一个简单库位图

zrender实现一个库位图

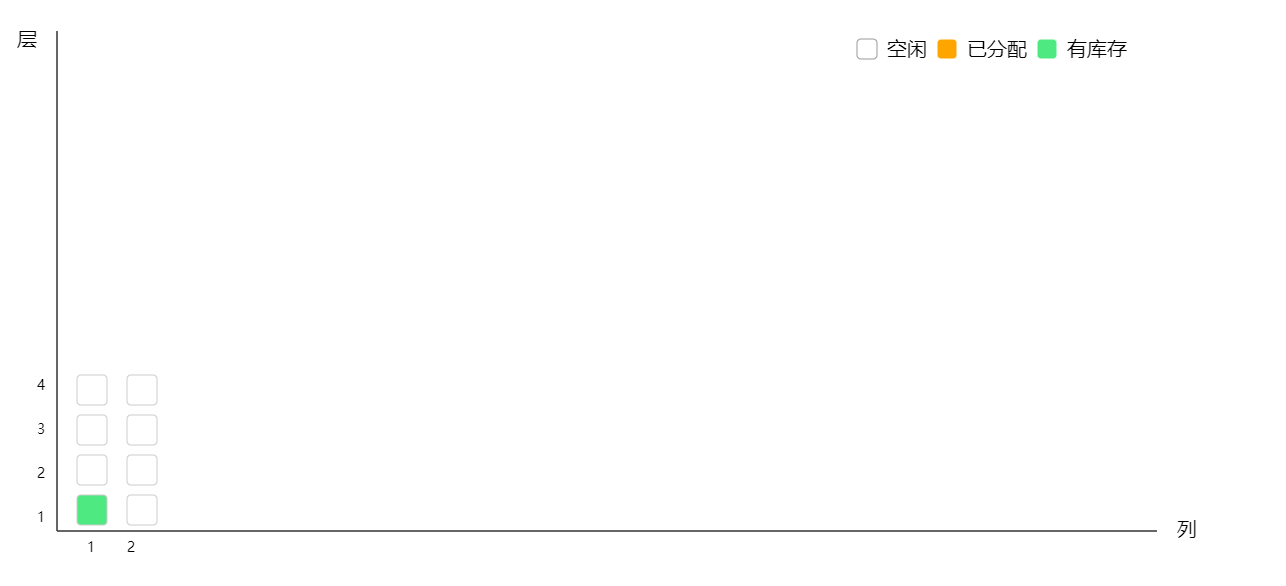
公司业务要求写一个库位图,看了看 echarts 的实例,没有能够拿来直接使用的,只好使用 zrender 来自定义实现,下面记录一下过程。

首先,在项目中安装依赖

1
npm install zrender@5.2.1 --save

声明我们的容器 div

1
<div id="canvas"></div>

在项目中引用 zrender

1
2
3
4
5
6
7
8
9
10
11
12
13
14
15
16
17
18
19
20
21
22
<script>
import * as zrender from 'zrender'; import CanvasPainter
from'zrender/lib/canvas/Painter'; zrender.registerPainter('canvas',
CanvasPainter)
</script>

<script>
export default {
data() {
return {
canvas1: null,
group: new zrender.Group()
}
},
mounted() {
this.canvas1 = zrender.init(document.getElementById('canvas1'), {
width: 1180,
height: 580
})
}
}
</script>

开始绘制

我一开始绘制的是两条线来表示层和列:

1
2
3
4
5
6
7
8
9
10
11
12
13
14
15
16
17
18
19
20
21
22
23
24
25
26
const line = new zrender.Rect({
shape: {
x: 40,
y: 520,
width: 1100,
height: 0
},
style: {
fill: '#fff',
stroke: '#333'
}
})
const line2 = new zrender.Rect({
shape: {
x: 40,
y: 20,
width: 0,
height: 500
},
style: {
fill: '#fff',
stroke: '#333'
}
})
this.canvas1.add(line)
this.canvas1.add(line2)

紧接着我开始考虑如何画每一个库位,后端传过来的是一个数组,我一开始用很笨的数组循环遍历方法,后来猛然想起可以用数组的 forEach 方法啊,而且 zrender 也提供了 add 方法来添加图形,真的是好久不用脑子都生锈了:

1
2
3
4
5
6
7
8
9
10
11
12
13
14
15
16
17
18
19
20
21
22
23
24
25
26
27
28
29
30
31
32
33
34
35
36
37
38
39
40
41
42
43
44
45
46
47
48
// 遍历数组,添加矩形
this.list.forEach((row, i) => {
const rect = new zrender.Rect({
shape: {
x: 60 + (row.positionColumn - 1) * 50,
y: 524 - row.positionLayer * 40,
width: 30,
height: 30,
r: 4
},
style: {
fill: '#fff',
stroke: '#ccc'
},
message: row
})
// 给每一个矩形添加mouseover事件 改变他们的位置、大小和样式
rect.on('mouseover', () => {
rect.attr({
style: { stroke: 'orange', fill: '#fff' },
shape: {
x: 56 + (row.positionColumn - 1) * 50,
y: 518 - row.positionLayer * 40,
width: 34,
height: 34
}
})
})
// 给每一个矩形添加mouseout事件 改变他们的位置、大小和样式
rect.on('mouseout', () => {
rect.attr({
style: { stroke: '#ccc', fill: '#fff' },
shape: {
x: 60 + (row.positionColumn - 1) * 50,
y: 522 - row.positionLayer * 40,
width: 30,
height: 30
}
})
})
// 添加到画布当中去
this.group.add(rect)
})
// 给包裹矩形的父容器来添加mouseover事件,并将事件对象传递过去
this.group.onmouseover = (e) => {
// 调用addMenu方法
this.addMenu(e)
}

将矩形添加到画布中以后,还要实现鼠标滑过的时候显示他们的一些信息(code、排列信息和状态)所以我们还要再声明一个方法来做这件事:

1
2
3
4
5
6
7
8
9
10
11
12
13
14
15
16
17
18
19
20
21
22
23
24
25
26
27
28
29
30
31
32
33
34
35
36
37
38
39
40
41
42
43
44
45
46
// 清除计时器
this.menuTimer && clearTimeout(this.menuTimer)
// 清除画布上的弹出层
this.clearMenu()
// 边界判断
if (e.target.message) {
// message对象是我们在绘制rect的时候传递给rect的
const message = e.target.message
// 我们要显示的信息
const text = `库位编号:${message.code}
排列层: ${message.positionPlatoon}排-${message.positionColumn}列-${message.positionLayer}
库位状态: ${message.status} `
// 用一个矩形来做弹出层
const menu = new zrender.Rect({
name: 'menu',
shape: {
width: 160,
height: 60,
x: e.offsetX + 20,
y: e.offsetY - 20
},
style: {
fill: 'rgba(107,107,107,.6)',
textFill: '#ffffff',
text: text,
textLineHeight: 26,
shadowColor: '#000000',
shadowBlur: 3
},
textContent: new zrender.Text({
style: {
text: text,
fill: '#fff',
x: e.offsetX + 30,
y: e.offsetY
}
})
})
// 将这个弹出层添加到画布中去
this.group.add(menu)
}
// 添加一个计时器,3秒后自动消失
this.menuTimer = setTimeout(() => {
this.clearMenu()
this.menuTimer && clearTimeout(this.menuTimer)
}, 3000)

接下来我们要绘制的是右上角的 label 提示用户不同的色块代表不同的状态:

1
2
3
4
5
6
7
8
9
10
11
12
13
14
15
16
17
18
19
20
21
22
23
24
25
26
27
28
29
30
31
32
33
34
35
36
37
38
39
40
41
42
43
44
45
46
47
48
49
50
51
52
53
54
55
56
57
58
59
60
61
62
63
64
65
66
67
68
69
70
71
72
73
74
75
76
77
78
79
// 代表空闲的白色矩形
const kongxianRect = new zrender.Rect({
shape: {
x: 840,
y: 28,
width: 20,
height: 20,
r: 4
},
style: {
fill: '#fff',
stroke: '#999'
}
})
// 空闲文字
const kongxianText = new zrender.Text({
style: {
x: 870,
y: 30,
text: '空闲',
fontSize: 20,
textFill: '#999'
}
})
// 代表分配状态的橙色矩形
const fenpeiRect = new zrender.Rect({
shape: {
x: 920,
y: 28,
width: 20,
height: 20,
r: 4
},
style: {
fill: 'orange',
stroke: '#fff'
}
})
// 代表分配的文字
const fenpeiText = new zrender.Text({
style: {
x: 950,
y: 30,
text: '已分配',
fontSize: 20,
textFill: '#999'
}
})
// 代表有库存的绿色矩形
const kucunRect = new zrender.Rect({
shape: {
x: 1020,
y: 28,
width: 20,
height: 20,
r: 4
},
style: {
fill: '#4ee981',
stroke: '#fff'
}
})
// 代表有库存的文字
const kucunText = new zrender.Text({
style: {
x: 1050,
y: 30,
text: '有库存',
fontSize: 20,
textFill: '#999'
}
})
// 将它们添加到画布中去
this.canvas1.add(kongxianRect)
this.canvas1.add(kongxianText)
this.canvas1.add(fenpeiRect)
this.canvas1.add(fenpeiText)
this.canvas1.add(kucunRect)
this.canvas1.add(kucunText)

接下来继续添加文字表示层和列:

1
2
3
4
5
6
7
8
9
10
11
12
13
14
15
16
17
18
19
20
21
22
23
// 表示层的文字
const textLayer = new zrender.Text({
style: {
x: 0,
y: 20,
text: '层',
fontSize: 20,
textFill: '#000'
}
})
// 表示列的文字
const textColumn = new zrender.Text({
style: {
x: 1160,
y: 510,
text: '列',
fontSize: 20,
textFill: '#000'
}
})
// 将它们添加到画布当中去
this.canvas1.add(textLayer)
this.canvas1.add(textColumn)

然后呢,我们还要添加表示层和列的索引:

1
2
3
4
5
6
7
8
9
10
11
12
13
14
15
16
17
18
19
20
21
22
23
24
25
26
27
28
// 根据list数组的最后一项,拿到我们这个库位一共有几层几列
const last = this.list[this.list.length - 1]
// 循环遍历添加表示层数的数字
for (let i = 0; i < last.positionLayer; i++) {
const layerText = new zrender.Text({
style: {
x: 20,
y: 500 - 44 * i,
text: i + 1,
fontSize: 14,
textFill: '#999'
}
})
this.canvas1.add(layerText)
}
// 循环遍历添加表示列数的数字
for (let i = 0; i < last.positionColumn; i++) {
const layerText = new zrender.Text({
style: {
x: 110 + (i - 1) * 40,
y: 530,
text: i + 1,
fontSize: 14,
textFill: '#999'
}
})
this.canvas1.add(layerText)
}